Additional Projects / Data Engineering
F1 Data Platform
An Azure Databricks–focused data engineering solution turning 70+ years of Formula 1 history into a governed Lakehouse — with dominance analysis surfaced through Databricks notebooks and Power BI.
Developer
Anthony Calek
Platform
Microsoft Azure
Focus
Azure Databricks
Date
April 2024
Solution Architecture
F1 records from the Ergast API are ingested over HTTP by Data Factory into a raw data lake, transformed in Azure Databricks across Delta Lake layers — governed by Unity Catalog — then served as Databricks dashboards and Power BI reports.
Ergast API (HTTP)
70+ years of F1 records ingested over HTTP, managed by Data Factory.
Azure Data Factory
Pipelines orchestrate ingestion into the raw data lake.
Data Lake (Raw)
Landing layer for the raw ingested datasets.
Databricks + Delta Lake
PySpark & SparkSQL build ingested → presentation Delta layers.
Databricks + Power BI
Notebook dashboards and Power BI reports on the presentation layer.
Governance — Unity Catalog and a central metastore provide fine-grained access control, data lineage and audit logging, while Delta Lake enforces ACID transactions and schema across the ingested and presentation layers.
How it works
Databricks offers two compute types — All-Purpose for interactive development and Job compute for scheduled production work. Storage mounts securely through the Azure ecosystem, and notebooks mix PySpark, SparkSQL and pure SQL for flexible transformation.
The Lakehouse builds on Delta Lake for both ingestion and presentation layers. A central metastore underpins Unity Catalog — maintaining metadata, enabling ACID guarantees and schema enforcement, and powering fast data discovery across the platform.
Built following the “Azure Databricks and Spark for Data Engineers” course by Ramesh Retnasamy.
Power BI Reports
A five-page report on F1 dominance, built on the presentation datasets — switch between the pages below.
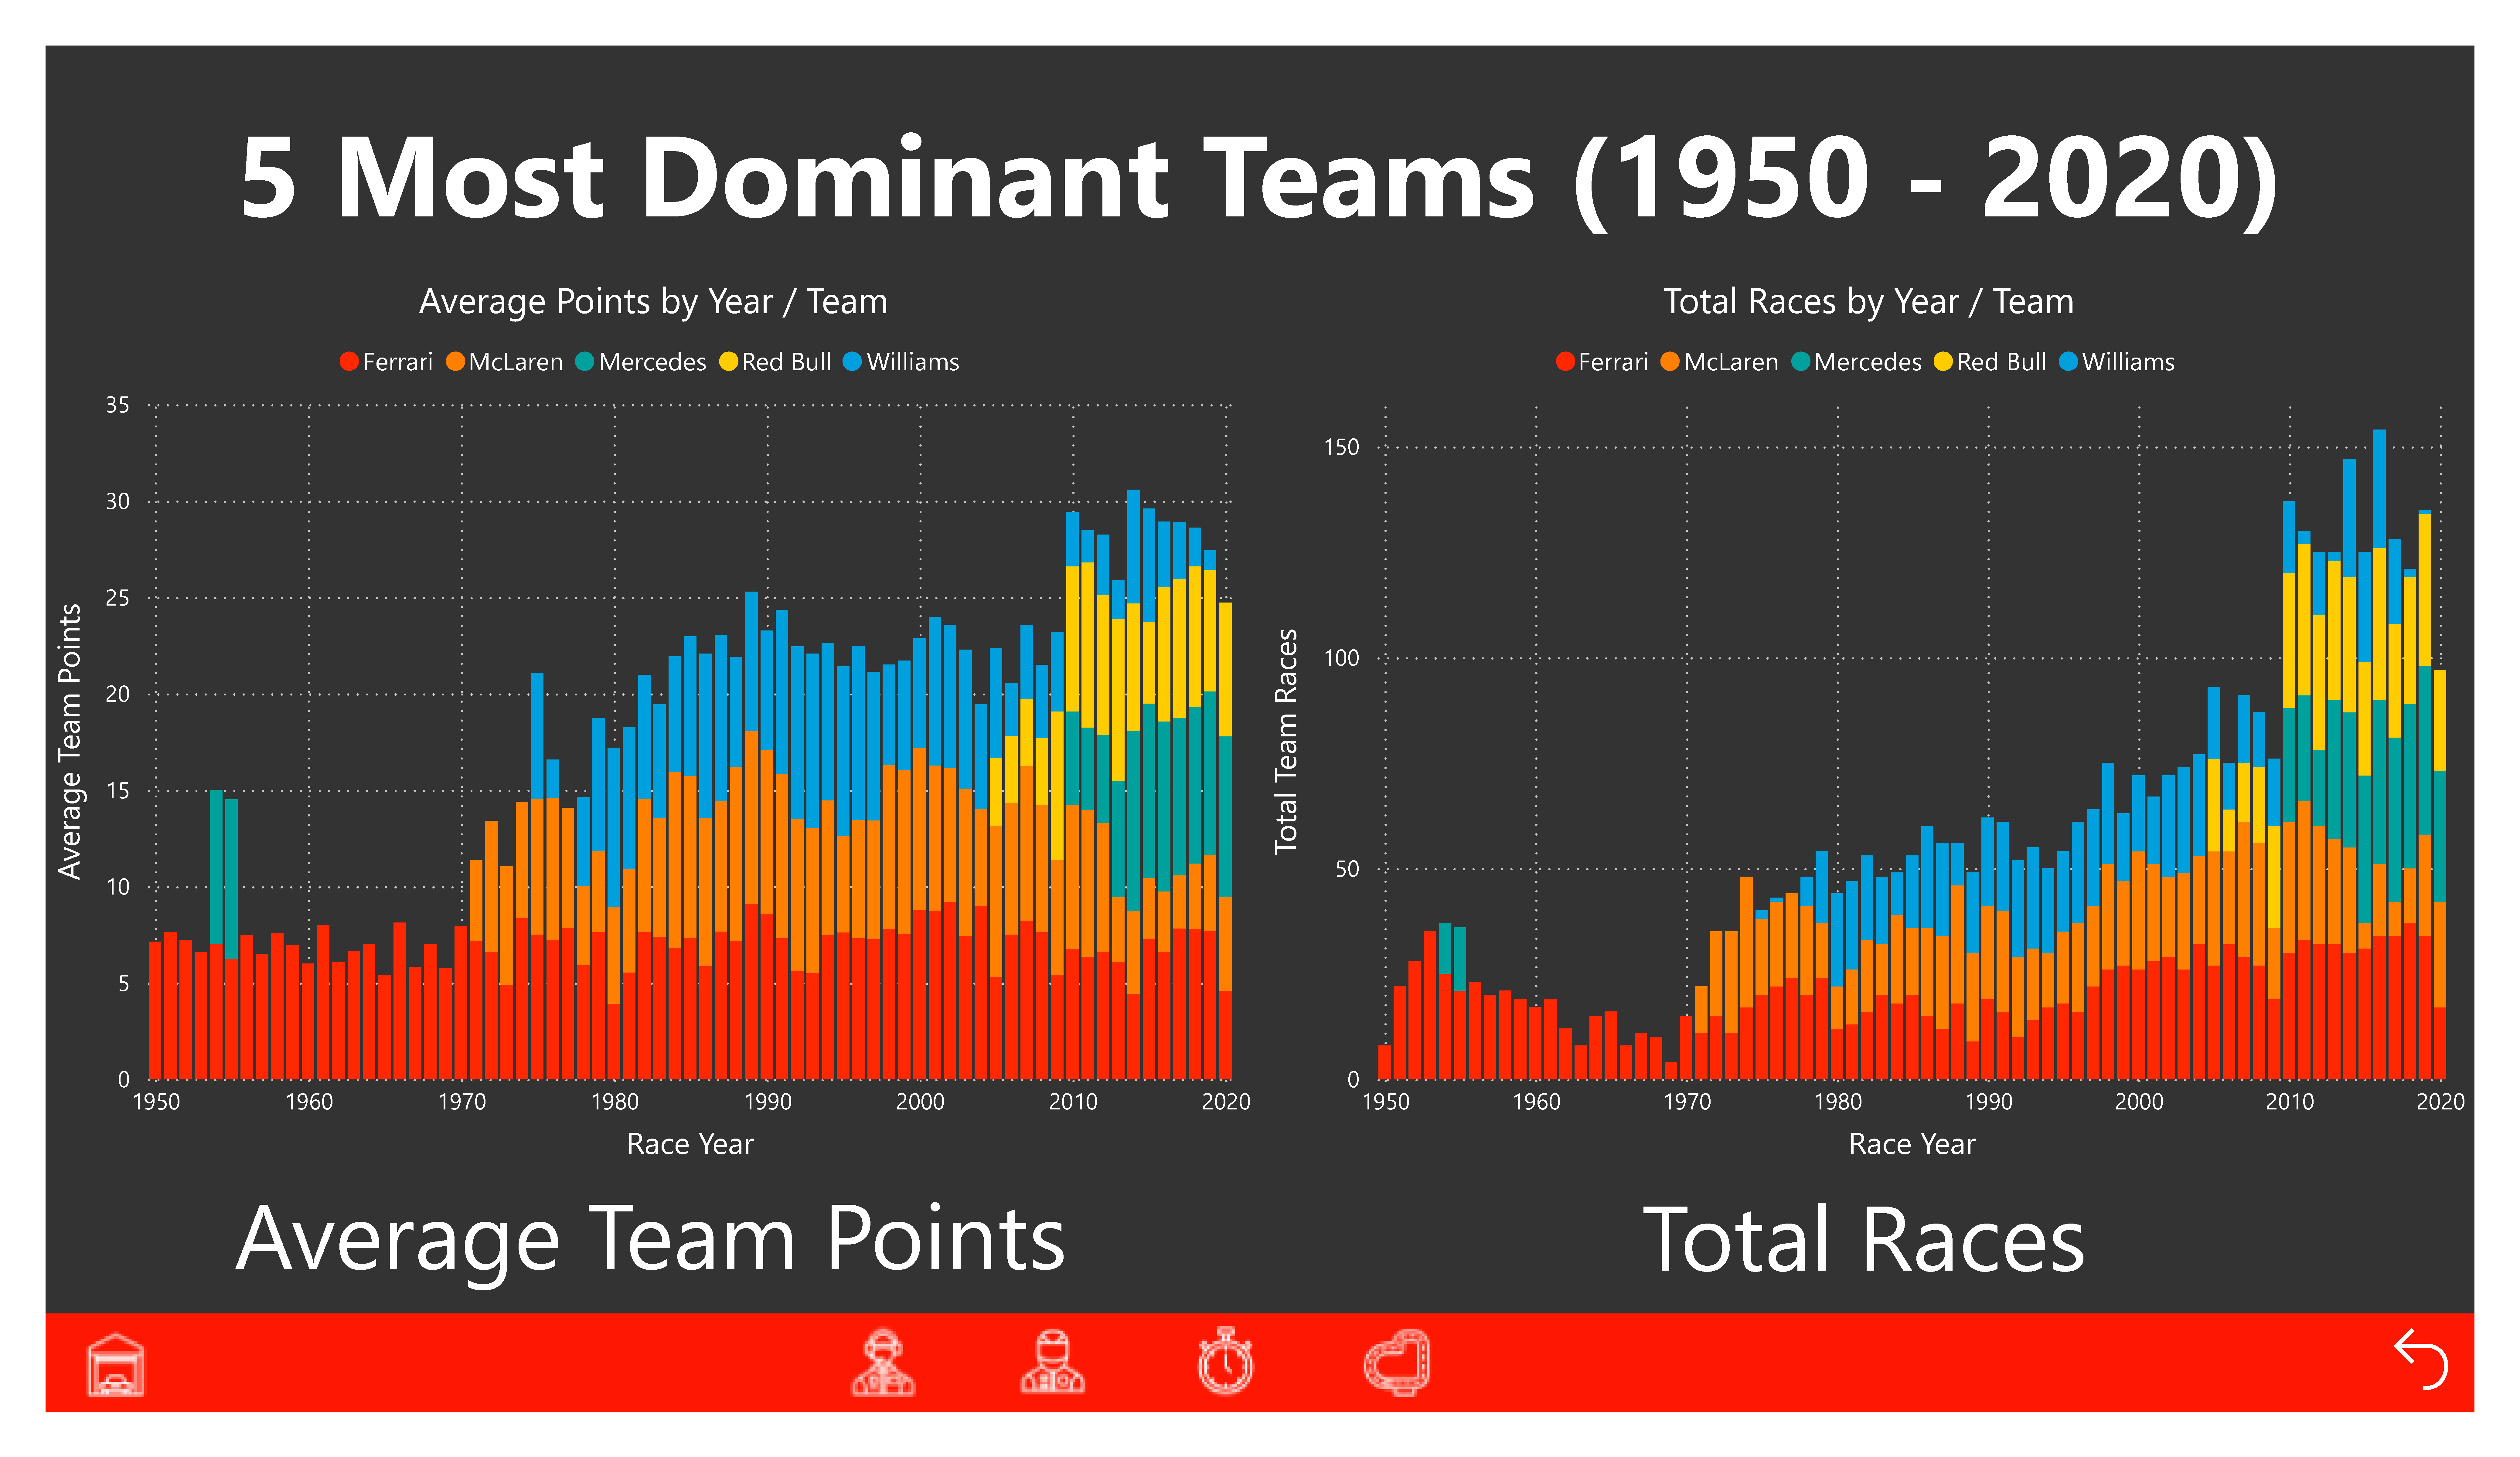
Producing high-quality visuals directly in Databricks — without always reaching for Power BI — underscores its strength as an integrated, end-to-end engineering solution.
From the Original Documentation
The original Azure-styled diagrams produced for the project, preserved here as source artifacts.
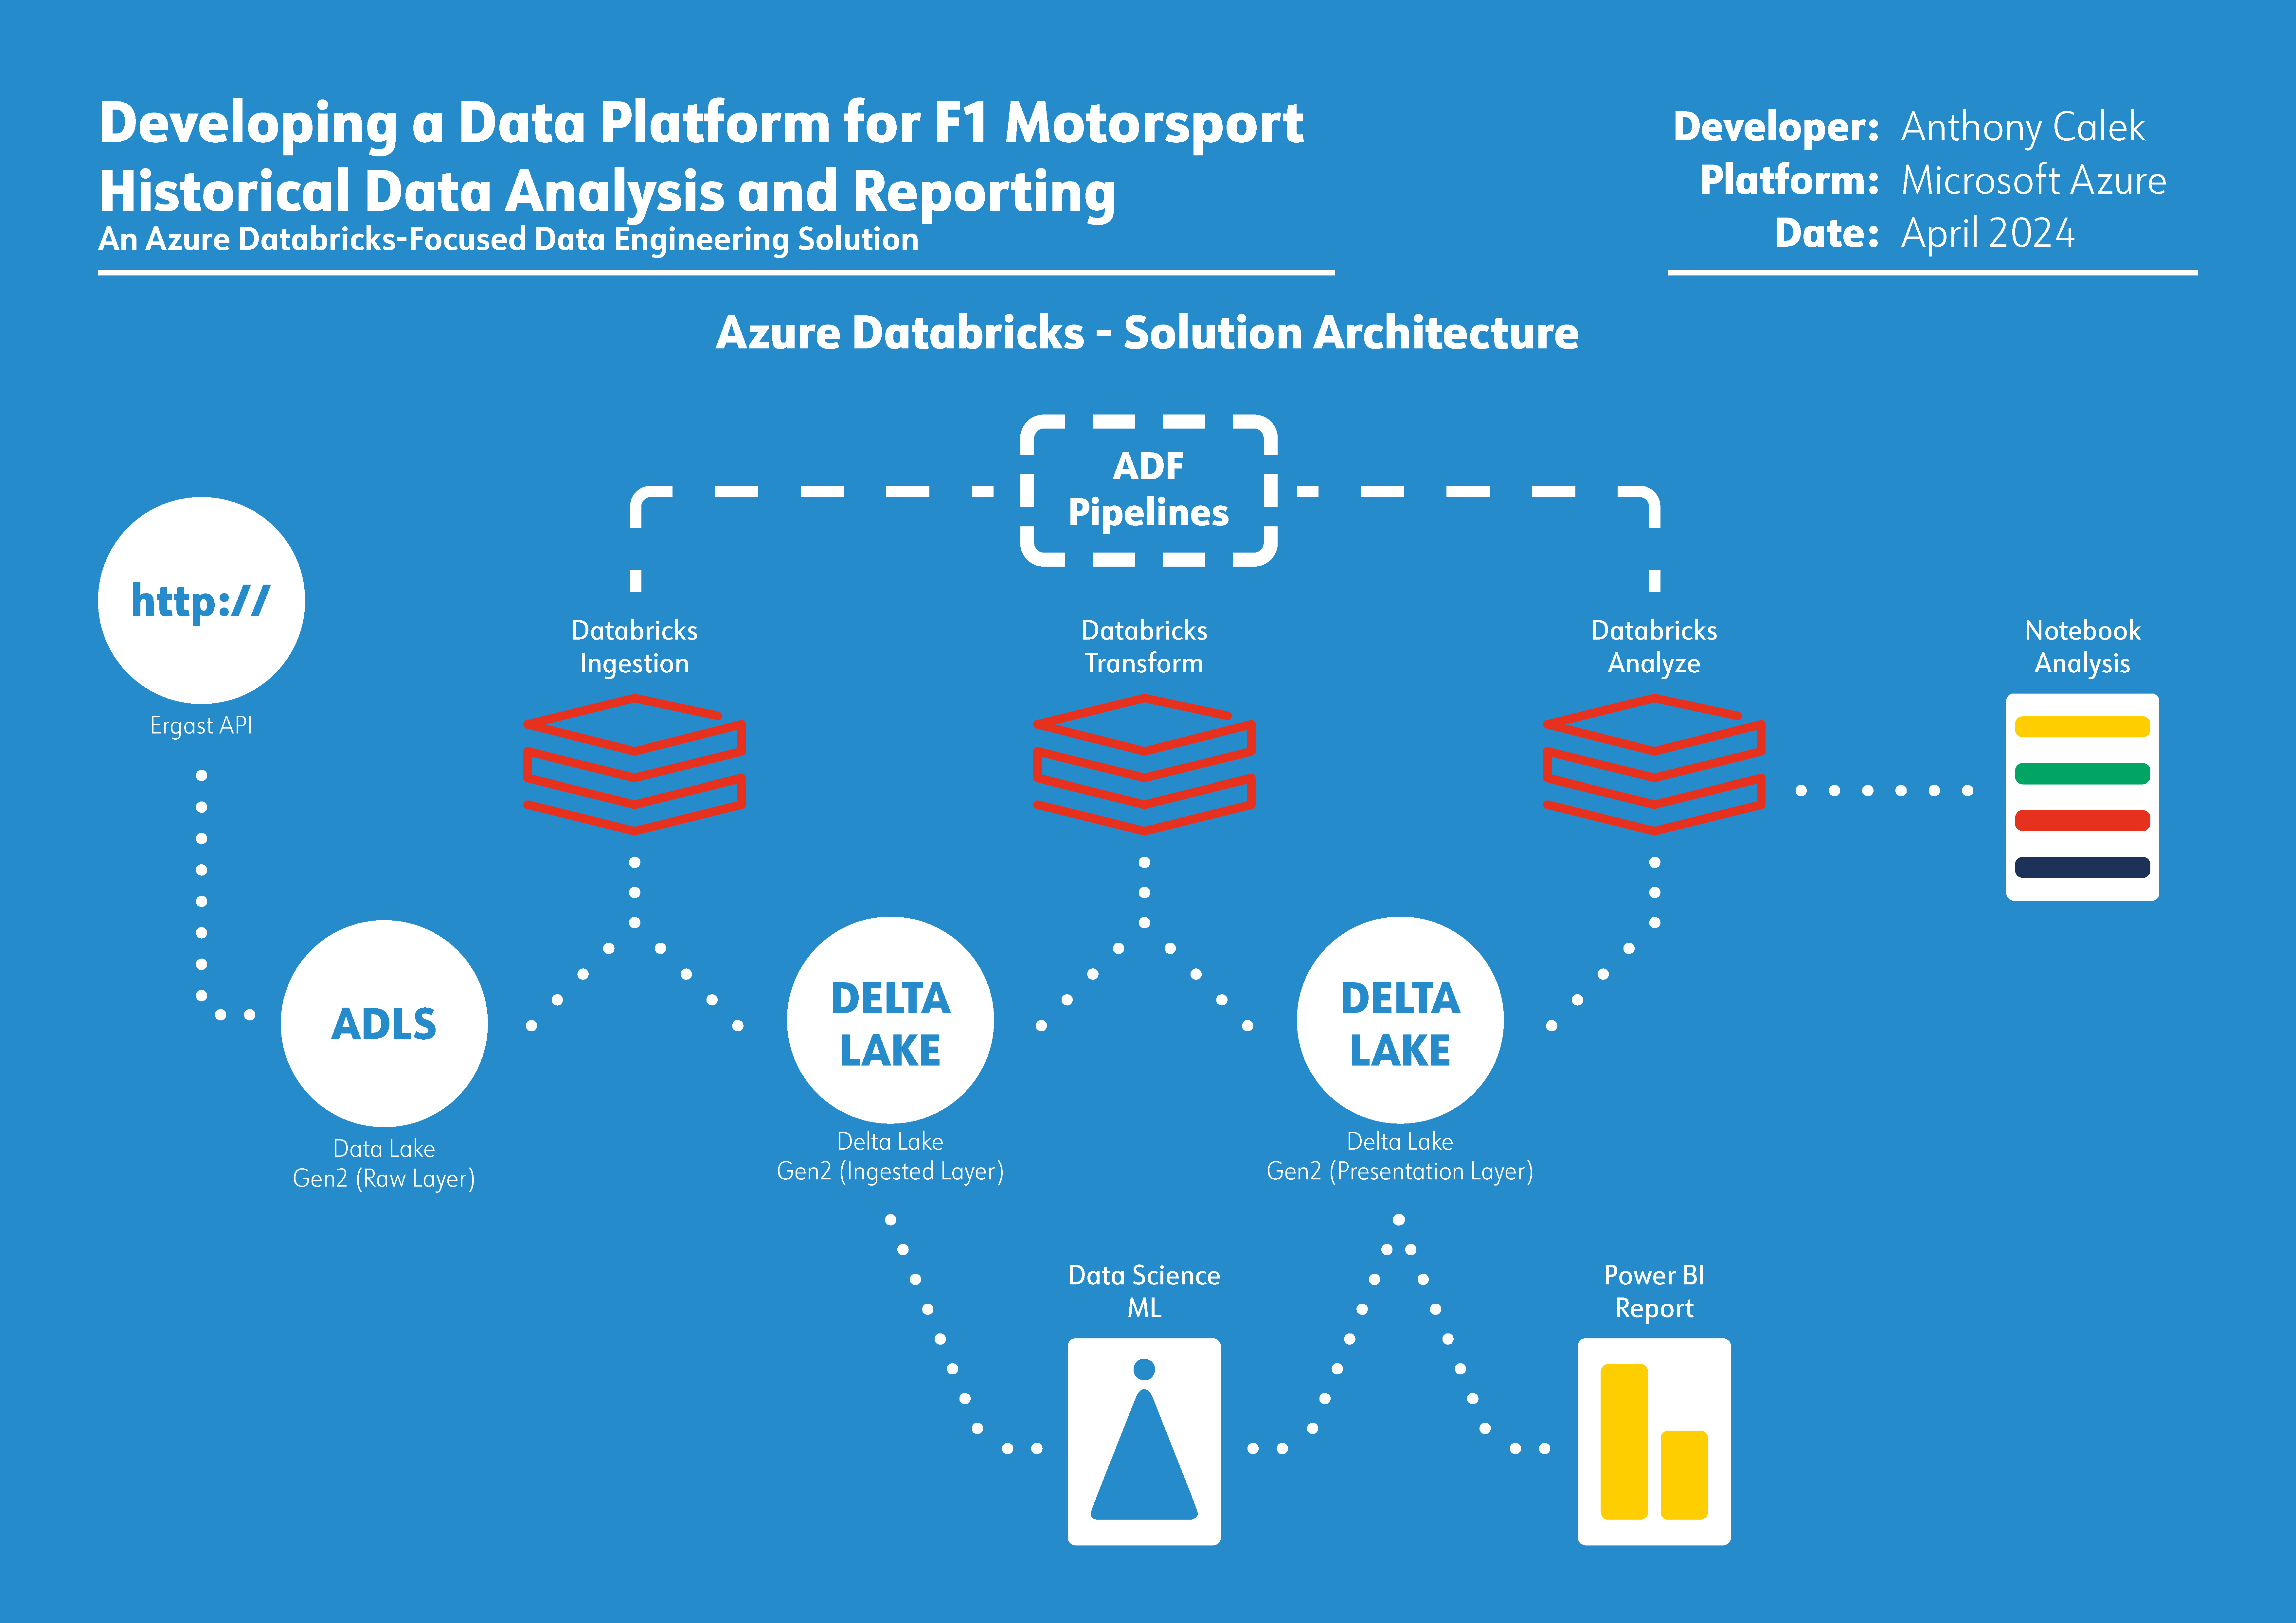
Original solution architecture
The Azure Databricks Lakehouse architecture from the original project documentation.
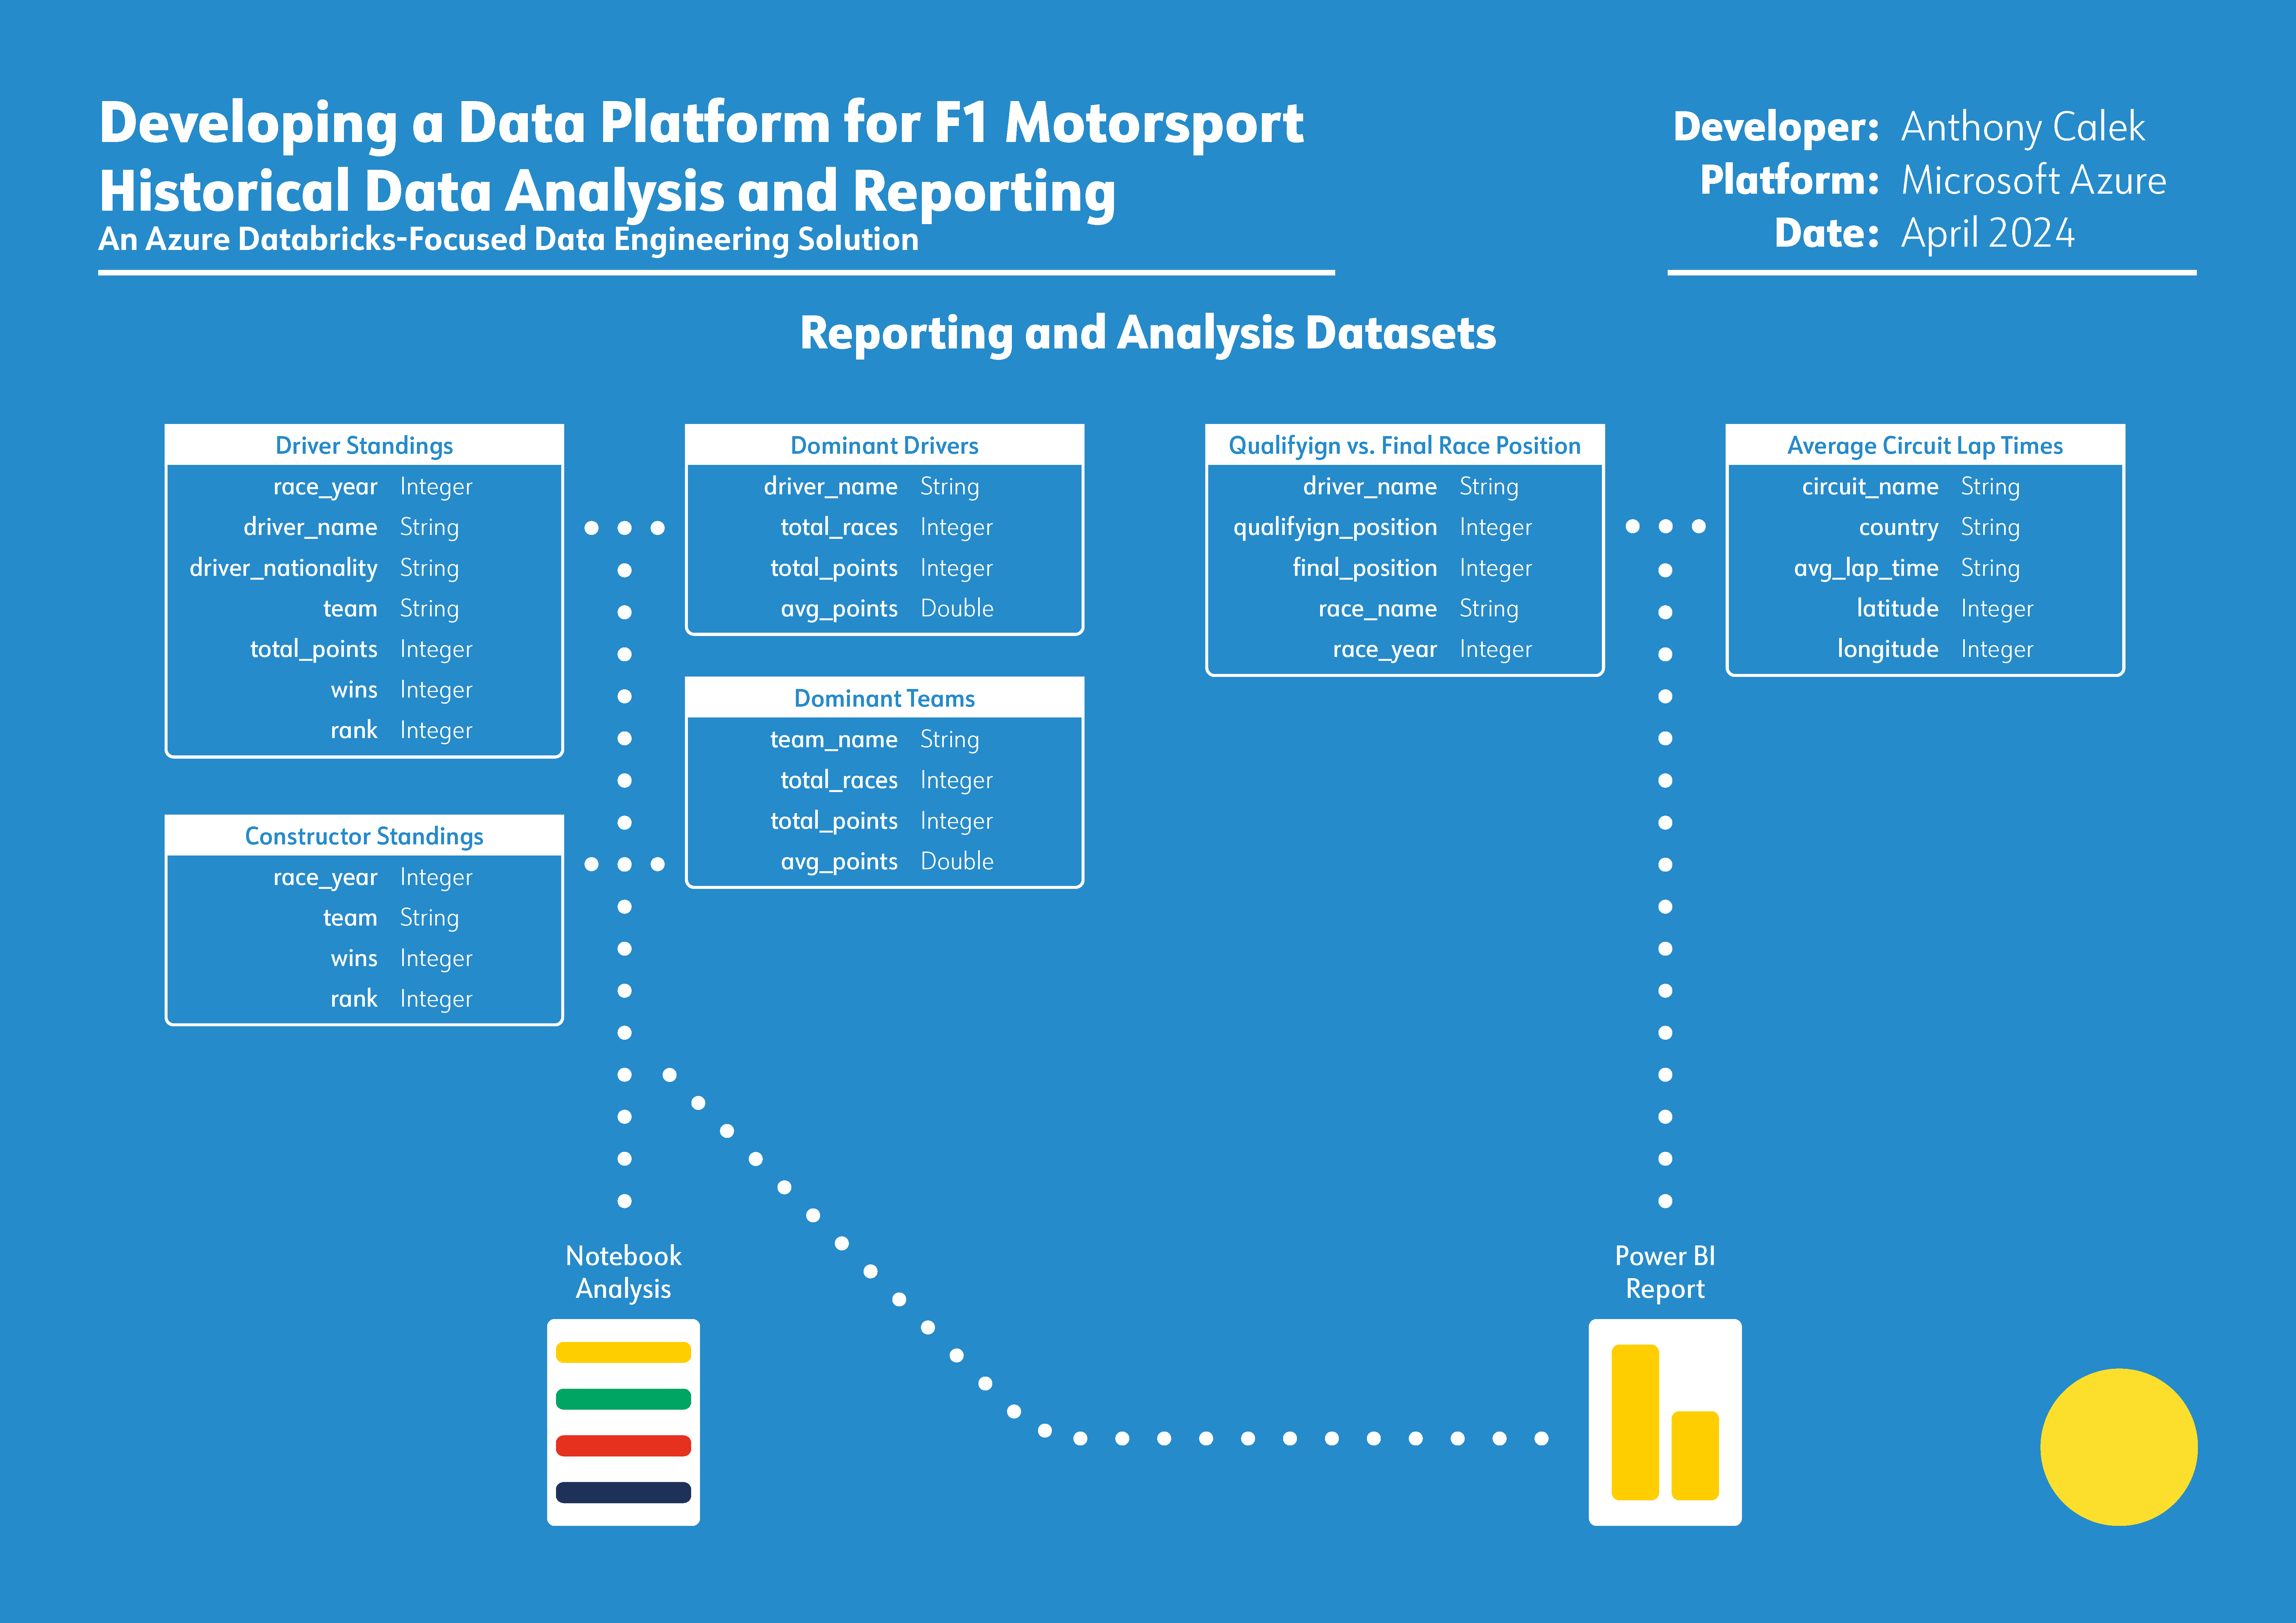
Databricks notebook dashboard
Analysis presented directly inside a Databricks notebook dashboard — no Power BI required.